Explainable ML: SHAP, LIME & Model Debugging
Explain what your models do and why: glass-box models, feature importance, PDPs, LIME, SHAP and its limits, counterfactuals, saliency maps, and error analysis.
Before this: Machine Learning. Deep Learning for the Grad-CAM and integrated gradients steps.
-
 7 min
Step 1
What explainable AI is
Why we need explanations and the main families of methods.
Explainable AI explained! | #1 IntroductionDeepFindr
-
 7 min
Step 2
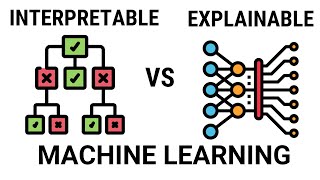
Interpretable vs. explainable models
Models you can read directly versus explanations added after training.
Interpretable vs Explainable Machine LearningA Data Odyssey
-
 12 min
Step 3
Glass-box models: Explainable Boosting Machines
Microsoft Research on additive models that stay readable yet accurate.
The Science Behind InterpretML: Explainable Boosting MachineMicrosoft Developer
interpretml/interpret★ 7k -
 13 min
Step 4
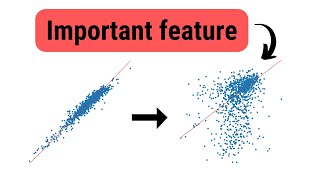
Permutation feature importance
Shuffle one feature, measure the drop in score, coded from scratch.
Permutation Feature Importance from Scratch | Explanation & Python CodeA Data Odyssey
-
 12 min
Step 5
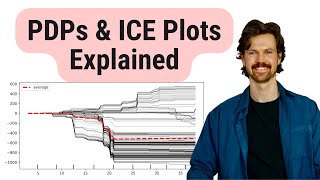
Partial dependence and ICE plots
See how predictions change as one feature moves, on average and per row.
Partial Dependence (PDPs) and Individual Conditional Expectation (ICE) Plots | Intuition and MathA Data Odyssey
-
 14 min
Step 6
LIME
Fit a simple local model around one prediction to approximate the black box.
Explainable AI explained! | #3 LIMEDeepFindr
marcotcr/lime★ 12.2k -
 15 min
Step 7
Shapley values
The game theory idea behind SHAP: average each feature's marginal contribution.
Shapley Values : Data Science Conceptsritvikmath
-
 16 min
Step 8
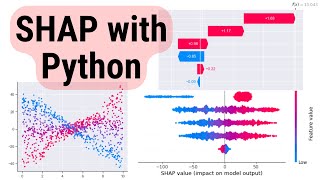
SHAP in Python
Waterfall, force, beeswarm, and dependence plots on a real model.
SHAP with Python (Code and Explanations)A Data Odyssey
shap/shap★ 25.9k -
 7 min
Step 9
The limits of SHAP
Correlated features, baselines, and why SHAP values are not causal effects.
4 Significant Limitations of SHAPA Data Odyssey
-
 56 min
Step 10
Fooling LIME and SHAP
Talk showing a biased model can be built to get innocent-looking explanations.
Hima Lakkaraju: How can we fool LIME and SHAP? Adversarial Attacks on Explanation MethodsHarvard's CRCS
-
 17 min
Step 11
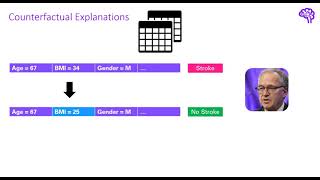
Counterfactual explanations
The smallest input change that flips a decision, and its link to adversarial examples.
Explainable AI explained! | #5 Counterfactual explanations and adversarial attacksDeepFindr
interpretml/DiCE★ 1.5k -
 14 min
Step 12
Saliency maps with Grad-CAM
Highlight the image regions a CNN's prediction depends on.
Grad-CAM Explained | FREE XAI Course | L7 - Gradient-weighted Class Activation MappingA Data Odyssey
jacobgil/pytorch-grad-cam★ 13k -
 16 min
Step 13
Integrated gradients and feature attribution
Stanford lecture on gradient attribution methods and the axioms they satisfy.
Feature Attribution | Stanford CS224U Natural Language Understanding | Spring 2021Stanford Online
meta-pytorch/captum★ 5.7k -
 1h 19m
Step 14
Debugging models with error analysis
Andrew Ng's process for diagnosing bias, variance, and pipeline errors.
Lecture 12 - Debugging ML Models and Error Analysis | Stanford CS229: Machine Learning (Autumn 2018)Stanford Online
Build it
Watching isn't learning. Pick one and put it on GitHub.
- Train a gradient-boosted model on a public tabular dataset and compare its SHAP, permutation, and built-in importances in one short report.
- Fit an Explainable Boosting Machine and an XGBoost model on the same data, then compare accuracy and what each says about the top three features.
- Run Grad-CAM on 20 images a pretrained CNN gets wrong and write down what the heatmaps suggest it was looking at.